
Project Title
Go Green
"Go Green" is a collaborative software development course project centered around UN Sustainable Goal 13: Climate Action. Aligned with Goal 13, which emphasizes the necessity of addressing climate change through policies and education, our mission is to inspire Seattle residents to adopt more sustainable modes of daily transportation. By encouraging these eco-friendly choices, we aim to contribute to the reduction of carbon footprints in the community.
Type /
Course Project
Role /
Developer,
Project Manager
Duration /
10 Weeks
Year /
2023
Tools /
JavaScript, React, Vercel, Figma

Problem Context

For this project, we focused on UN Sustainable Goal 13: Climate Action.
According to Goal 13, we need to take action to combat climate change through policies and education.
Causes of Climate Change
-
Cars and other vehicles are a common household source of carbon emissions, accounting for 28% of total emissions in 2021.
-
The largest source coming from “light duty trucks” which includes SUVs and minivans.
-
The average carbon a typical passenger vehicle “emits about 4.6 metric tons of carbon dioxide per year.”

Sources:
Greenhouse Gas Emissions From A Typical Passenger Vehicle, 2023
Sources of Greenhouse Gas Emissions, 2023
Why is this important to address?
-
Climate change impacts everyone.

Sources:
Climate Change - United Nations Sustainable Development, 2023
Problem Statement
-
How might we encourage residents of Seattle to utilize more sustainable modes of daily transportation in order to reduce their carbon footprint?


Design Process
1_User Personas


2_Key Features

3_Overview: Low-Fidelity & Annotations


3.1_Carbon Emissions Calculator: Low-Fidelity

3.2_Transportation Knowledge Quiz: Low-Fidelity


3.3_Resources Page: Low-Fidelity

Brainstorm Whiteboard

Static Page - Combination Option

4_Acceptance Testing
To ensure that our website is usable and meets our expectations for a fully functioning MVP, we outlined these acceptance tests, such as:
-
Features rendering correctly
-
Calculator only taking integer values
-
Quiz storing and displaying user score and results
-
Links directing users to the correct page on the website

5_User Testing
Process
We conducted 4 user testing sessions with 2-3 people in each session to understand the user experience of one of our key features: the transportation knowledge quiz (high fidelity draft 1).

Participants Demographics
All were all iSchool students at the University of Washington. In the future, we hope to conduct more user testing and diversify our participant pool.

Insights
-
Reduce scrolling
-
Put quiz results on a separate page to distinguish quiz and quiz results better
-
Make quiz options (A, B, C, D) smaller, since it currently takes up the whole screen
-
-
Increase clarity of purpose
-
Direct attention to resource page
-
High Fidelity Screen Draft 1 for the Transportation Knowledge Quiz


Design Decisions
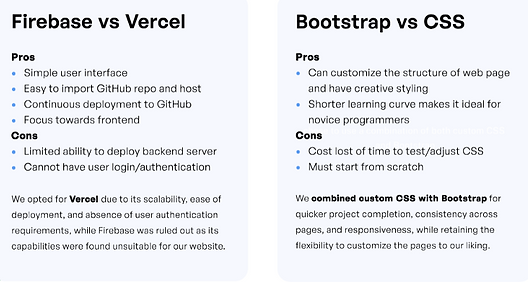
1_Technical Design Decisions: Hosting Platform

2_Visual Design Decisions: Theme + Logo

3_Homepage

Our homepage aims to give an introduction to our site’s key features as well as who created the app.
4_Carbon Emissions Calculator
The carbon emissions calculator allows users to input how far they are traveling + mode of transit to get the amount of carbon emissions and more sustainable modes of transit.


5_Carbon Emissions Calculator (Results)
The results page show the emissions their planned trip will emit as well as other options of travel.

6_Resources
The resources page serves as a hub for users to learn more about different modes of transit. Each mode is clickable and turns into a dropdown with explanation + video.

7_Transportation Knowledge Quiz
The transportation knowledge quiz allows users to test their knowledge on different facts on transportation in Seattle.

8_Transportation Knowledge Quiz (Results)
The results page for the quiz displays a pie chart of correct and incorrect answers and explanations for each one.

9_Demo Video

Takeaways & Next Steps
Takeaways -

Next Steps -


References
Bergerson, E. (2020, January 8). Seattle Traffic Report gives an in-depth look at 2018 travel trends. SDOT Blog. https://sdotblog.seattle.gov/2019/12/31/seattle-traffic-report-gives-an-in-depth-look-at-2018-travel-trends/#:~:text=On%20average%2C%20people%20took%20about,trips%20were%20on%20surface%20streets
Climate Change - United Nations Sustainable Development (2023). United Nations Sustainable Development. https://www.un.org/sustainabledevelopment/climate-change/
Environmental Protection Agency. (2023). Greenhouse Gas Emissions From A Typical Passenger Vehicle. https://www.epa.gov/greenvehicles/greenhouse-gas-emissions-typical-passenger-vehicle#typical-passenger
Environmental Protection Agency. (2023). Sources of Greenhouse Gas Emissions. https://www.epa.gov/ghgemissions/sources-greenhouse-gas-emissions#transportation
Sources of greenhouse gas emissions | US EPA. (n.d.). https://www.epa.gov/ghgemissions/sources-greenhouse-gas-emissions
Where do greenhouse gas emissions come from? (2017). University of California. https://www.universityofcalifornia.edu/news/where-do-greenhouse-gas-emissions-come